
It’s really easy to get lost in a whole host of different metrics when it comes to marketing funnels. So how do you stay out of the weeds when evaluating how well your Facebook or Google ads and subsequent sales funnel or landing pages are performing?
By keeping it simple. You should only really care about two metrics: Click Through Rate, and Conversion Rate, and then take action based on the two.
Click Through Rates
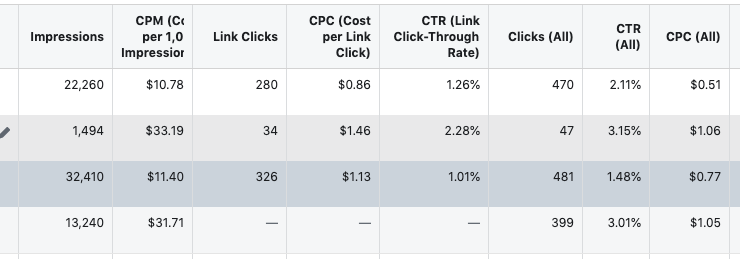
Click through rates are simply the rate at which people click your ad based on relevance and interest to your target audience. For instance, if you received 1,000 impressions on an ad, and 10 people clicked on it, your click through rate is 1%. 1% is pretty standard, but click through rates vary widely depending on industry, product, audience, etc. and range on average between 0.5% – 3%.
So what do I do about my Click Through Rate? Well, if your click through rate is on the low end and people aren’t responding to your ad or offer, simply try out some new ads (different copy, picture, or video), a different audience, or a new offer. It takes a bit of testing to see what your target audience will respond to. Just because one audience isn’t responding to an ad, doesn’t mean a different demographic/audience will, so test ads with different types of people. Over time, you should be able to get your click through rate up by adjusting these different levers.
Conversion Rates
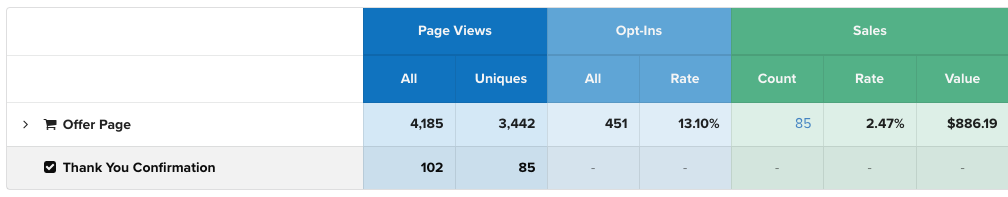
Conversion rates are simply the rate at which people take the action you want them to take when they land on your marketing funnel’s landing page. You could have an opt-in funnel and then it would be the rate that people gave you their email address. If you have a product funnel (either physical or digital), it is the rate at which people purchase your offer. So if 1000 people visit your funnel, and then 43 people opt in to your email list, your conversion rate is 4.3%. Average conversion rates for email opt-ins are about are 5% – 30% depending on interest level and what you are offering in exchange for an email address. Average conversion rates for product sales are about 1% – 5%.
So what do I do about my Conversion Rate? Conversion rate optimization tends to be a little more tricky of a metric to optimize for than click through rates since there are many more options for you to change. While entire books or countless articles could be (and are) written on conversion rate optimization for your funnel, these are a few of the major things to start with:
- Change your Offer (Try a different price point, include a different bonus, etc.)
- Change and improve your Sales Copy
- Change the Video or Pictures you are using
- Add testimonials or social proof to your landing page
When you are starting out, stick with testing and changing the big things like your offer and sales copy; the button color doesn’t really matter that much in the beginning. As you more finally tune your marketing funnel, you can work on tweaking those smaller changes to get a little more edge on your conversion rate.
Conclusion
If you keep it simple and just focus on optimizing and improving these two basic metrics for your sales or marketing funnel, you will be a lot more successful than others that focus on indirect performance metrics. Funnels and Marketing are a process that takes time to tweak and optimize, but as you work on improving the click through rate and conversion rate, that is ultimately what will deliver you the best results.